Piotr Wozniak, 1990-2000
This text was derived from P.A.Wozniak, Optimization of learning : Simulation of the learning process conducted along the SuperMemo schedule (1990) and has been updated with revised figures (original text included additional figures related to the forgetting rate which has been significantly overestimated due to an error in the implementation of the simulation model)
Important! For the newest material on spaced repetition see: “Theoretical aspects of spaced repetition in learning.”
This article should help you plan your learning and better understand your lifetime capacity for learning new things. Most of the figures and formulas have been theoretically derived. However, over the last ten years, these theoretical constructs have been confirmed many times by exact measurements taken during an actual learning process
A simple simulation model makes it possible to predict the outcome of a long-term learning process based on spaced repetition. Probability of forgetting at each repetition is determined by the forgetting index. By using a Spaced Repetition Algorithm and a real distribution of element difficulty (A-Factor Distribution), it is possible to predict the course of learning over many years by means of computer simulation (note that you can run a similar simulation of your own learning process based on your own real learning data in SuperMemo 98 and later with Tools : Statistics : Simulation)
The simulation model takes the following assumptions:
- Learning proceeds along a standard repetition spacing algorithm (e.g. Algorithm SM-11)
- A bell-shaped distribution of A-factors is taken from a generic knowledge system created with SuperMemo
- The matrix of optimal factors is taken from a generic knowledge system and does not change in the course of the learning process
- At repetitions, a specified portion of items, determined by the forgetting index, is taken as forgotten and reenters the process without a change to their A-factors
The above assumptions eliminate the following problems that might otherwise be encountered while trying to estimate the results of a long-term learning process:
- The variability of individual mnemonic skills can be entirely encompassed by the distribution of A-factors (Point 2). After all, the same knowledge system used by a skilled student will show a greater proportion of higher A-factors
- The variability of the difficulty of the studied material, which again, can entirely be reflected by the distribution of A-factors (Point 2)
- The variability of the mnemonic capability of the brain as a result of training, which is discounted by using a constant distribution of A-factors (Point 2)
- The variability of the mnemonic capability of the brain with aging, which can be discounted by using a constant value of the matrix of optimal factors (Point 3). A significant loss of memory with aging can be observed only as a result of a pathological process or because of lack of training (Restak 1984). Otherwise, the mnemonic capability of the brain is likely to increase with age as a result of training!
For simplicity of the description, in the following paragraphs I will use the term generic material, meaning a learning material with a typical distribution of A-factors. It is important to notice that the term reflects also the mnemonic capability of the student. This comes from the fact that good students tend to exhibit a greater proportion of high A-factors in their collections.
Here is the short summary of conclusions that could be drawn from simulation experiments based on the discussed model:
- The learning curve obtained by using the model, except for the very initial period, is almost linear (see Figure 1)
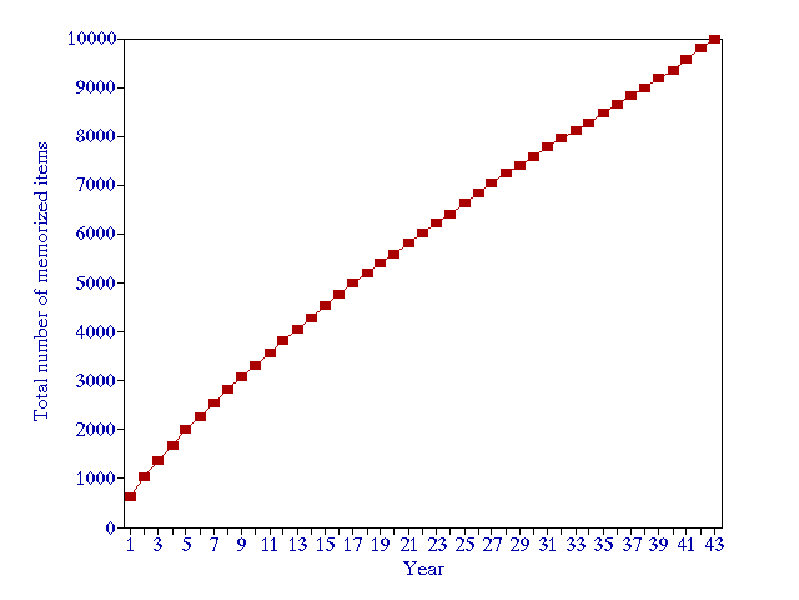
Figure 1 Learning curve for a generic material, forgetting index equal to 10%, and daily working time of 1 minute
- In a long-term process, for the forgetting index equal to 10%, the average rate of learning for generic material can be approximated to 200-300 items/year/min, i.e. one minute of learning per day results in acquisition of 200-300 items per year. Users of SuperMemo usually report the average rate of learning from 50-2000 items/year/min
- For a generic material, the number of items memorized in consecutive years when working one minute per day can be approximated with the following equation:
NewItems=aar*(3*e– 0.3*year+1)
+1)
- where:
- NewItems – items memorized in consecutive years when working one minute per day,
- year – ordinal number of the year,
- aar – asymptotic acquisition rate, i.e. the minimum learning rate reached after many years of repetitions (usually about 200 items/year/min)
- Eliminating 10% of the most difficult items in a generic material may produce an increase in the speed of learning of up to 300%. The lower the forgetting index, the greater the increase.
- In a long-term process, for the forgetting index equal to 10%, and for a fixed daily working time, the average time spent on memorizing new items is only 5% of the total time spent on repetitions. This value is almost independent of the size of the learning material
- The maximum lifetime capacity of the human brain to acquire new knowledge by means of learning procedures based on the discussed model can be estimated as no more than several million items.
- For a generic material and the forgetting index of about 10%, the function of time required daily for repetitions per item can roughly be approximated using the formula:
time = 1/500 * year-1.5 + 1/30000
- where:
- time – average daily time spent for repetitions per item in a given year (in minutes),
- year – year of the process.
- As the time necessary for repetitions of a single item is almost independent of the total size of the learned material, the above formula may be used to approximate the workload for learning material of any size.
For example, the total workload for a 3000-element collection in the first year will be 3000/500*1+3000/30000=6.1 (min/day).
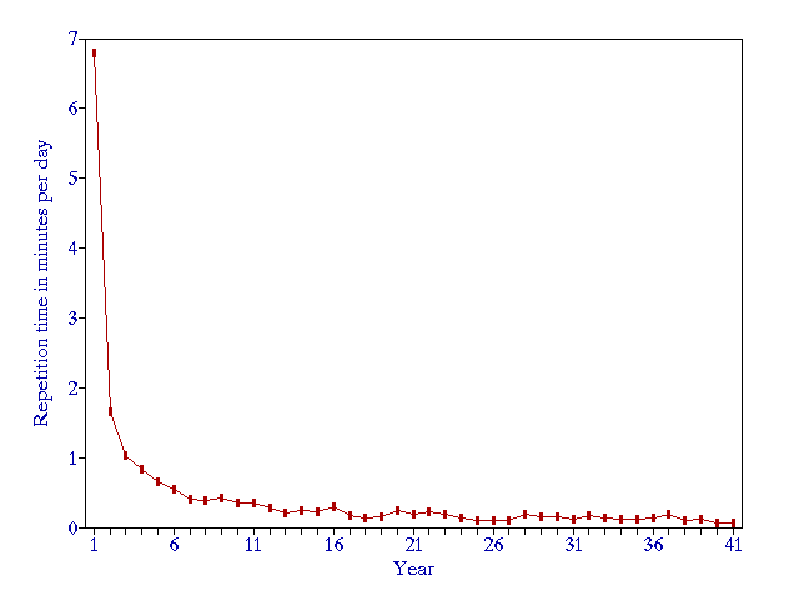
Figure 2 Workload, in minutes per day, in a generic 3000-item learning material, for the forgetting index equal to 10%
- The relationship between the forgetting index and knowledge retention can accurately be expressed using the following formula:
- Retention = –FI/ln(1-FI)
- Retention – overall knowledge retention expressed as a fraction (0..1),
- FI – forgetting index expressed as a fraction (forgetting index equals 1 minus knowledge retention at repetitions).
- The greatest overall increase in the optimal interval can be observed for the forgetting index of about 20%. The overall increase takes into the consideration the fact that for forgotten items, the optimal interval decreases. Therefore, for the forgetting index greater than 20%, the positive effect of long intervals on memory resulting from the spacing effect is offset by the increasing number of forgotten items.
- The greatest overall knowledge acquisition rate is obtained for the forgetting index of about 20-30% (see Figure 3). This results from the trade-off between reducing the repetition workload and increasing the relearning workload as the forgetting index progresses upward. In other words, high values of the forgetting index result in longer intervals, but the gain is offset by an additional workload coming from a greater number of forgotten items that have to be relearned.
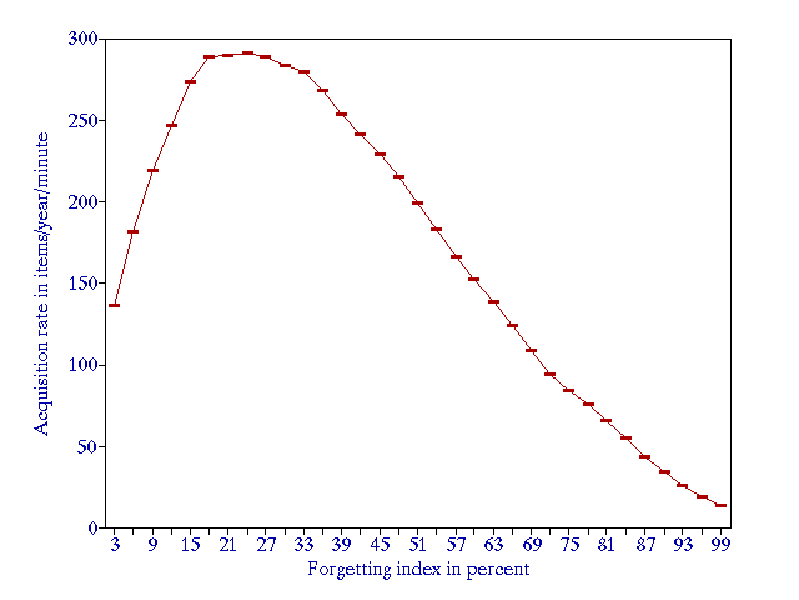
Figure 3 Dependence of the knowledge acquisition rate on the forgetting index
- When the forgetting index drops below 5%, the repetition workload increases rapidly (see Figure 3). The recommended value of the forgetting index used in the practice of learning is 6-14%.
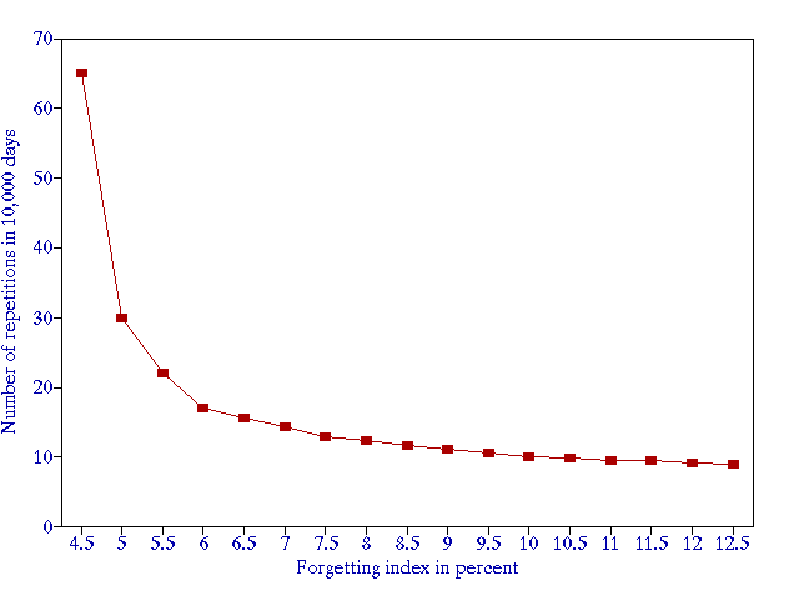
Figure 4 Trade-off between the knowledge retention (forgetting index) and the workload (number of repetitions of an average item in 10,000 days)
- As compared with equally spaced repetition schedules, for the forgetting index equal to 10%, in the period of 50 years, the discussed model produces an about 50-fold increase in the speed of knowledge acquisition (i.e. speed of learning)
- In a long-term learning process, 50% of repetitions are devoted to 2.5% of short-interval learning material (actual learning process measurements). This number can vary greatly in practice and in ill-structured learning material, even a smaller proportion of items can take most of the learning time. A user of SuperMemo can use SuperMemo’s statistical tools to verify this number on his/her own. The actual figures will strongly depend on the intensity of memorizing new material. The following example is taken from a 10-year-long learning process:
| Length of interval | Percent of elements | Percent of workload |
|---|---|---|
| Length of interval | Percent of elements | Percent of workload |
| 1-60 days | 5% | 63% |
| 61-300 days | 13% | 23% |
| 301-1000 days | 19% | 7% |
| over 1000 days | 63% | 7% |
- The following table illustrates the proportion of time spent on repetitions of material characterized by a different number of memory lapses (actual learning process measurements):
| Number of lapses | Percent of elements | Percent of workload |
|---|---|---|
| Number of lapses | Percent of elements | Percent of workload |
| 0 | 62% | 42% |
| 1 | 16% | 16% |
| 2 | 9% | 15% |
| 3 | 5% | 9% |
| 4 | 3% | 6% |
| 5 and more | 5% | 12% |
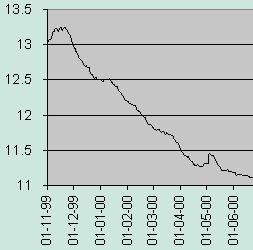
- The following figure shows an actual recovery of the measured forgetting index after a one-time use of the rescheduling algorithm (Tools : Mercy) spanning a rescheduling period of about 20 days. The average requested forgetting index was equal to 10%. The measured forgetting index was reset at the time of rescheduling and surpassed 13% shortly after resuming repetition. The measured forgetting index returned to the level of 11% only after 7 months of repetitions
