Dr Piotr A. Wozniak, SuperMemo R&D, SuperMemo World, Poznan, Poland Dr Edward J. Gorzelanczyk, Assistant Professor, University of Bydgoszcz, Poland Dr Janusz A. Murakowski, Assistant Professor, University of Delaware, USA; Spring 2005
This article is a popularized rewrite of a paper “The two-component model of long-term memory. Symbolic formula describing the increase in memory stability for varying levels of recall” presented at Cybernetic Modelling of Biological Systems. A particular emphasis is placed on highlighting the role of SuperMemo in collecting data that helped refine the two-component model of long-term memory. The article also adds some practical conclusions that might affect learning strategies among users of SuperMemo
1. S/R Model of memory
10 years ago we published a paper that delineated a distinction between the two components of long-term memory: stability and retrievability (Wozniak, Gorzelanczyk, Murakowski, 1995). The paper provided the first outline of the so-called S/R Model that makes it easier to build molecular models of long-term memory. Until now, the stability-retrievability distinction has not made a major impact on research in the field. Here we re-emphasize the importance of the S/R Model and sum up the findings of the last decade that refine the S/R Model and highlight its importance in the deconvolution of seemingly contradictory research in the field of memory and learning.
2. Why do we need two variables to describe long-term memory?
In the literature on memory and learning, we often encounter an ill-defined term: strength of memory (or strength of synaptic connections). However, if we look at how information is assimilated by the human mind, we notice that there must be at least two independent variables that could stand for the strength of memory. On one hand, after a review of a learned piece of knowledge, we remember things well. We may say that “after a review, memory is strong”. On the other hand, after years of keeping a piece of information in memory, we say that “memory of the fact is strong” even though, at times, we may hesitate while trying to recall the fact. In the two said cases, we speak of two different phenomena that are both labeled as memory strength. Disentangling the two is vital if we are to avoid contradictory findings in memory research. We proposed two distinct names for the two components of long-term memory (Wozniak, Gorzelanczyk, Murakowski, 1995):
- memory retrievability determines how easy it is to retrieve a memory trace (i.e. recall it)
- memory stability determines how long a memory trace can last in memory (i.e. not be forgotten)
3. Intuitive interpretation of the memory variables: retrievability and stability
Both retrievability and stability of long-term memory can be correlated with a number of molecular or behavioral variables. However, for the purpose of further analysis, we propose two intuitive measures of the two components:
- Let us express retrievability R as the probability of retrieving a piece of information from memory. Although, the actual probability as measured for a given piece of information is usually close to 1 or close to 0 (approaching “all or nothing” characteristic of low-level neural transmission), the present definition is useful in investigating populations of memory traces. In a population of independent memories, the probability of forgetting is constant per engram per unit time. This results in a continual decline of memory engrams. If we know the decay function, we can estimate the probability of recall of a piece of information in a given uniform population at a given time. We will show later that retrievability as a function of time is well approximated by the exponential decay R=e-d*t where t is time and d is a decay constant for a given homogenous population of memory traces
- Let us express stability S as the inter-repetition interval that produces retrievability of 0.9. Although, at the molecular level, stability might be subject to a slow drift, our intuitive definition sets it at a constant level between reviews. This assumption is valid for we are only interested in stability and its increase at the time of review
These two intuitive interpretations of retrievability and stability will make it easier to develop further mathematical descriptions of changes in long-term memory variables over time depending on the rehearsal patterns (i.e. the timing of repetitions).
We express the changes in retrievability as:
- (3.1) R=e-d*t
where:
- t – time
- R – probability of recall at time t (retrievability)
- d – decay constant dependent on the stability
We can replace the constant d dependent on stability, with a constant k that is independent of stability:
- (3.2) R=e-k*t/S
where:
- t – time
- R – probability of recall at time t
- S – stability expressed by the inter-repetition interval that results in retrievability of 90% (i.e. R=0.9)
- k – constant independent of stability
Now we can obtain the value of k. According to the definition of stability S, at time t=S, retrievability is R=0.9:
- (3.3) 0.9=e-k*S/S
- (3.4) ln(0.9)=-k
- (3.5) k=ln(10/9)
We will use Eqns. (3.2) and (3.5) frequently throughout this article.
4. Memory is optimized to meet probabilistic properties of the environment
It has been proposed in the 1980s, that properties of memory can be derived from the study of the events in the environment (Anderson&Schooler, 1991). The guiding light of this proposition is the intuition that memory should reflect probabilistic properties of the environment. Such a reflection is likely considering a relatively easy evolutionary adjustment of molecular memory properties targeted at optimum survival through maximizing the storage of useful information without abusing storage capacity.
Interesting conclusions have been drawn, among others, from studying the patterns of occurrence of selected keywords in New York Times. If memory “strength” was to reflect the probability of a re-encounter with a given word, we might conclude that the forgetting, reflecting the decline in memory strength, would optimally be a power function of time (in contrast to the exponential nature of forgetting concluded or assumed in a majority of publications).
Let us have a closer look at the New York Times example to illustrate how understanding of the distinction between retrievability and stability of memories could help us interpret Anderson’s work.
If we look at each memory episode as a Bernoulli trial, we can apply the binomial distribution to investigate the links between the episode frequency, re-occurrence interval, and the encounter probability. That would apply to the occurrence of words in New York Times as well. For a large number of trials and a low episode probability (here low keyword frequency), we can apply a Poisson distribution to approximate the binomial distribution and notice that Anderson’s observation on the power relationship describing the probability of word re-occurrence in New York Times as a function of interval since the last occurrence must be correct. In other words, probability of re-occurrence is proportional to the reciprocal of the interval since the last occurrence. Seemingly, the power function would adequately reflect the probability of episode re-occurrence. Negative power curve would then seem a solid evolutionary candidate to reflect forgetting in a well-optimized memory system.
However, Anderson, as most researchers then and now, rely on an ill-defined concept of memory strength. What if we make a clear-cut distinction between R and S. Which one, R or S, would reflect the probabilistic properties of the environment? R is a “delete timer”, which measures the interval since the last occurrence of the stimulus evoking a memory that is to be consolidated. If the average occurrence rate is inversely proportional to the interval since the last occurrence, probability of recall should show a negative power decline. However, there seems to be no correlation between the occurrence rate and retrievability. After each encounter (or repetition), probability of recall climbs back to 1. This climb-back is independent of the actual frequency of the occurrence of the stimulus! Moreover, for recall proportional to 1/t, we would be approaching infinity as t approaches 0. Retrievability definitely does not reflect the probability of re-encounter with the stimulus. Retrievability is used by the memory system only to time out the lifespan of memory traces. This span is longer for more relevant (frequent) stimuli, but the forgetting curve expressing R is not a reflection of the probability of re-encounter. As we will argue later, the forgetting curve is negatively exponential in nature despite the expectation of it being a negative power function.
Can then memory stability meet Anderson’s postulates? Stability of memory is a very solid measure of the occurrence rate. Each re-encounter with the stimulus boosts stability. If again we view the stream of stimuli as a Poisson process, we could expect both the probability of a re-encounter and the memory stability to increase in the r-th repetition as follows:
- (4.1) Pr(Nt=0)=e-ar*t
- (4.2) Pr+1(Nt=0)=exp(-ar*(r/(r-1))*t)
- (4.3) ln(Pr+1(Nt=0))=(ln(Pr(Nt=0))/t)*r/(r-1)*t=ln(Pr(Nt=0))*r/(r-1)
- (4.4) Pr+1(Nt=0)=Pr(Nt=0)^(r/(r-1))
- (4.5) Pr+1(Nt>0)=1-(1-Pr(Nt>0))^(r/(r-1))
where:
- t – time
- Pr(Nt=0) – probability of no encounter in time t before the r-th repetition
- Pr+1(Nt>0) – probability of encounter in time t after the r-th repetition
- ar – average encounter rate before the r-th repetition
If we denote the increase in stability as SInc, and expect it to match the increase in probability of the encounter, then
- (4.6) SInc=Pr+1(Nt>0)/Pr(Nt>0)
- (4.7) SInc=(1-(1-Pr)^(r/(r-1)))/Pr
For r=2 we have:
- (4.8) SInc=(1-(Pr2-2Pr+1))/Pr=(-Pr2+2Pr)/Pr=-Pr+2
For Pr approaching 0 we then have SInc approaching 2. This is precisely the intuitive increase in memory stability proposed for the first formulation of spaced repetition techniques that later evolved into SuperMemo. Also, for low values of Pr, and r>2, successive decline in the value of SInc mirrors the power decline of R-factors in SuperMemo.
In conclusion, what Anderson proposed in reference to memory strength, should be addresses to memory stability, not to memory retrievability. Instead of investigating forgetting curves, we should measure and analyze memory stability in successive reviews. The finding that forgetting is exponential in nature should not undermine Anderson’s postulates.
However, a observation that partly unravels the simplified model presented above, and severs the straightforward connection between memory and environment is that of the spacing effect. Clearly memory refuses to view the stream of environmental stimuli as a Poisson process. It does not treat individual events as independent. Memory takes into account clustering of events in time. This is to prevent clusters of probabilistically dependent events being equivalent in memory stability-building power to a numerically equivalent stream of independent events.
Andersons postulates are bound to be a solid guideline to understanding memory. The full elucidation of the link between environment and memory is a question of time. The S/R distinction should be monumentally helpful in avoiding confusion resulting from the superposition of the two properties of long-term memory.
5. The memory decay function is negatively exponential
Although it has always been suspected that forgetting is exponential in nature, proving this fact has never been simple. Exponential decay appears standardly in biological and physical systems from radioactive decay to drying wood; everywhere where expected decay count is proportional to the size of the sample, and where the probability of a single particle decay is constant. The following problems have hampered the effort of modeling forgetting since the years of Ebbinghaus (Ebbinghaus, 1885):
- small sample size
- sample heterogeneity
- confusion between forgetting curves, re-learning curves, practise curves, savings curves, trials to learn curves, error curves, and others in the family of learning curves
By employing SuperMemo, we can overcome all these obstacles to study the nature of memory decay. As a popular commercial application, SuperMemo provides virtually unlimited access to huge bodies of data collected from students all over the world. The forgetting curve graphs available to every user of the program (Tools : Statistics : Analysis : Forgetting curves) are plotted on relatively homogenic data samples and are bona fide reflection of memory decay in time (as opposed to other forms of learning curves). The quest for heterogeneity significantly affects the sample size though. It is important to note that the forgetting curves for material with different memory stability and different knowledge difficulty differ. Whereas memory stability affects the decay rate, heterogeneous learning material produces a superposition of individual forgetting curves each characterized by a different decay rate. Consequently, even in bodies with hundreds of thousands of individual pieces of information participating in the learning process, only relatively small homogenous samples of data can be filtered out. These samples rarely exceed several thousands of repetition cases. Even then, these bodies of data go far beyond sample quality available to researchers studying the properties of memory in controlled conditions. Yet the stochastic nature of forgetting, still makes it hard to make an ultimate stand on the mathematical nature of the decay function (see two examples below). Having analyzed several hundred thousands samples we have come closest yet to show that the forgetting is a form of exponential decay.
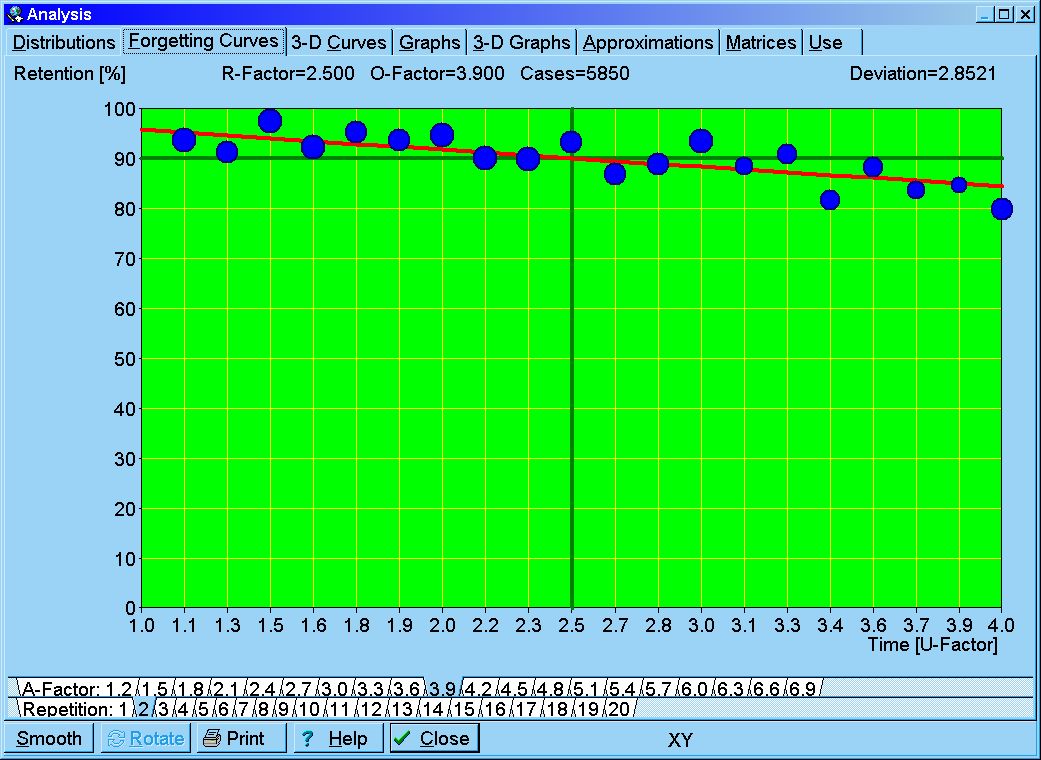
Fig. 5.1. Exemplary forgetting curve sketched by SuperMemo. The database sample of nearly a million repetition cases have been sifted for average difficulty and low stability (A-Factor=3.9, S in [4,20]), resulting in 5850 repetition cases (less than 1% of the entire sample). The red line is a result of regression analysis with R=e-kt/S. Curve fitting with other elementary functions demonstrates that the exponential decay provides the best match to data. The measure of time used in the graph is the so-called U-Factor defined as the quotient of the present and the previous inter-repetition interval. Note that the exponential decay in the range of R from 1 to 0.9 can plausibly be approximated with a straight line, which would not be the case had the decay been characterized by a power function.
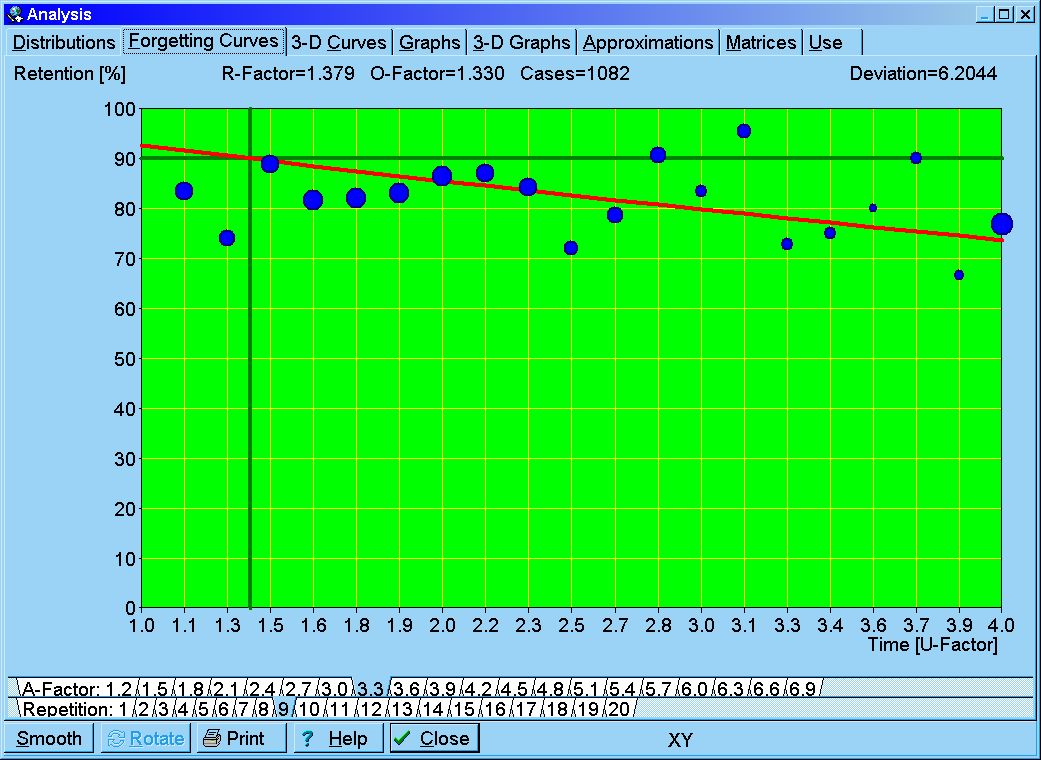
Fig. 5.2. Exemplary forgetting curve sketched by SuperMemo. The database sample of nearly a million repetition cases have been sifted for average difficulty and medium stability (A-Factor=3.3, S > 1 year) resulting in 1082 repetition cases. The red line is a result of regression analysis with R=e-kt/S
To illustrate the importance of homogenous samples in studying forgetting curves, let us see the effect of mixing difficult knowledge with easy knowledge on the shape of the forgetting curve. Fig. 5.3 shows why heterogeneous samples may lead to wrong conclusions about the nature of forgetting. The heterogeneous sample in this demonstration is best approximated with a power function! The fact that power curves emerge through averaging of exponential forgetting curves has earlier been reported by others (Anderson&Tweney 1997; Ritter&Schooler, 2002).
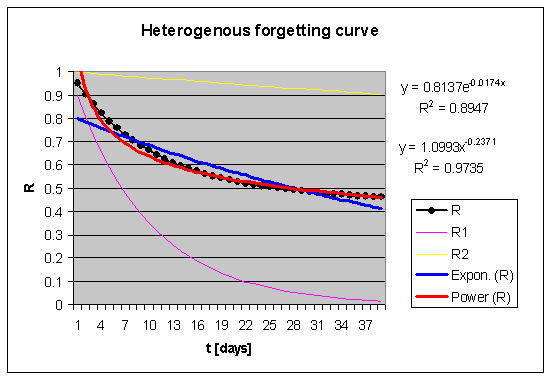
Fig. 5.3. Superposition of forgetting curves may result in obscuring the exponential nature of forgetting. A theoretical sample of two types of memory traces has been composed: 50% of the traces in the sample with stability S=1 (thin yellow line) and 50% of the traces in the sample with stability S=40 (thin violet line). The superimposed forgetting curve will, naturally, exhibit retrievability R=0.5*Ra+0.5*Rb=0.5*(e-k*t+e-k*t/40). The forgetting curve of such a composite sample is shown in granular black in the graph. The thick blue line shows the exponential approximation (R2=0.895), and the thick red line shows the power approximation of the same curve (R2=0.974). In this case, it is the power function that provides the best match to data, even though the forgetting of sample subsets is negatively exponential.
6. The magnitude of the increase in memory stability through rehearsal
Until now, we have not been able to formulate a universal formula that would link a repetition with an increase in memory stability. Repetition spacing algorithms proposed by the authors (Wozniak, Gorzelanczyk, 1992) are based on a general understanding on how stability increases when so-called optimum inter-repetition intervals are used (defined as intervals that produce a known recall rate that usually exceeds 90%). The term optimum interval is used for interval’s applicability in learning. The said repetition spacing algorithms also allow of determining an accurate stability increase function for optimum intervals in a matrix form. However, little has been known about the increase in stability for low retrievability levels (i.e. when intervals are not optimum). With data collected with the help of SuperMemo, we can now attempt to fill in this gap. Although SuperMemo has been designed to apply optimum intervals in learning, in real-life situations users are often forced to delay repetitions for various reasons (such as holiday, illness, etc.). This provides for a substantial dose of repetitions with lower retrievability in nearly every body of learning material. In addition, in 2002, SuperMemo introduced the concept of a mid-interval repetition that makes it possible to shorten inter-repetition intervals. Although the proportion of mid-interval repetitions in any body of data is very small, for sufficiently large data samples, the number of repetition cases with very low and very high retrievability should make it possible to generalize the finding on the increase in memory stability from the retrievability of 0.9 to the full retrievability range.
To optimally build memory stability through learning, we need to know the function of optimum intervals, or, alternatively, the function of stability increase (SInc). These functions take three arguments: memory stability (S), memory retrievability (R) and difficulty of knowledge (D). Traditionally, SuperMemo has always focused on dimensions S and D, as keeping retrievability high is the chief criterion of the optimization procedure used in computing inter-repetition intervals. The focus on S and D was dictated by practical applications of the stability increase function. In the presented article, we focus on S and R, as we attempt to eliminate the D dimension by analyzing “pure knowledge”, i.e. non-composite memory traces that characterize knowledge that is easy to learn. Eliminating the D dimension makes our theoretical divagations easier, and the conclusions can later be extended to composite memory traces and knowledge considered difficult to learn. In other words, as we move from practice to theory, we shift our interest from the (S,D) pair to the (S,R) pair. In line with this reasoning, all data sets investigated in this article have been filtered for item difficulty (in SuperMemo: A-factor ranging from 3.0 to 3.5 to balance a large number of items of knowledge versus a large number of repetitions). At the same time, we looked for possibly largest sets in which representation of items with low retrievability would be large enough as a result of delays in rehearsal (in violation of the optimum spacing of repetitions).
Below we describe a two step procedure that was used to propose a symbolic formula for the increase in stability for different retrievability levels in data sets characterized by low and uniform difficulty (so called well-formulated knowledge data sets that are easy to retain in memory). Well-formulated and uniform learning material makes it easy to distill a pure process of long-term memory consolidation through rehearsal. As discussed elsewhere in this article, ill-formulated knowledge results in superposition of independent consolidation processes and is unsuitable for the presented analysis.
The two-step procedure for determining the function of the increase in memory stability SInc:
- Step 1: Using a matrix representation of SInc and an iterative procedure to minimize the deviation Dev between the grades in a real learning process (data) and the grades predicted by SInc. Dev is defined as a sum of R-Pass over a sequence of repetitions of a given piece of knowledge, where R is retrievability and Pass is 1 for passing grades and 0 for failing grades
- Step 2: Using a hill-climbing algorithm to solve a least square problem to evaluate symbolic candidates for SInc that provide the best fit to the matrix SInc derived in Step 1
Let us define a procedure for computing stability of memory for a given rehearsal pattern. This procedure can be used to compute stability on the basis of known grades scored in learning (practical variant) and to compute stability on the basis of repetition timing only (theoretical variant). The only difference between the two is that the practical variant allows of the correction of stability as a result of stochastic forgetting reflected by failing grades.
In the following passages we will use the following notation:
- S(t) – memory stability at time t
- S[r] – memory stability after the rth repetition (e.g. with S[1] standing for memory stability after learning a new piece of knowledge)
- R(S,t) – memory retrievability for stability S and time t (we know that R=exp(-k*t/S) and that k=ln(10/9))
- SInc(R,S) – increase in stability as a result of a rehearsal for retrievability R and stability S such that SInc(R(S,t),S(t))=S(t”)/S(t’)=S[r]/S[r-1] (where: t’ and t” stand for the time of rehearsal as taken before and after memory consolidation with t”-t’ being indistinguishable from zero)
Our goal is to find the function of stability increase for any valid level of R and S: SInc=f(R,S).
If we can find SInc(R,S) and use S[1]=S1, where S1 is the stability derived from the memory decay function after the first-contact review (for optimum inter-repetition interval), then for each repetition history we can compute S using the following iteration:
r:=1;
S[r]:=S1
repeat
t:=Interval[r]; / where: Interval[r] is taken from a learning process (practical variant) or
/ from the investigated review pattern (theoretical variant)
Pass:=(Grade[r]>=3); / where: Grade[r] is the grade after the r-th interval (practical variant) or
/ 4 (theoretical variant)
R:=Ret(S[r],t);
if Pass then
S[r+1]:=S[r]*SInc[R,S[r]]
r:=r+1;
else begin
r:=1;
S[r]:=S1;
end;
until (r is the last repetition)Note that SuperMemo uses a first-interval graph to determine S1, which is progressively shorter after each failing grade. In the future, this more precise measure of S1 should be used for increased accuracy.
Step 1 – Finding SInc as a matrix
If we start off with an unknown matrix SInc[R,S], e.g. with all entries arbitrarily set to 2 (see Eqn. (4.8)) then we can use the above procedure on the existing repetition history data to compute SInc[R,S] that minimizes the deviation Dev=R-Pass. This is possible if we observe that:
- if Pass=true and S[r]<Interval[r] then SInc[R,S[r-1]] entry is underestimated (and can be corrected towards Interval[r]/S[r]*SInc[R,S[r-1]])
- if Pass=false and S[r]>Interval[r] then SInc[R,S[r-1]] entry is overestimated
This approach makes it possible to arrive at the same final SInc[R,S] independent of the original value of SInc[R,S] set at initialization. The application and the source code used to compute SInc[R,S] from repetition history data in SuperMemo is available from the authors upon request.
In Step 2, we will use the SInc[R,S] matrix obtained here to obtain a symbolic formula for SInc.
Step 2 – Finding SInc as a symbolic formula
We can now use any gradient descent algorithm to evaluate symbolic candidates for SInc that provide the best fit to the matrix SInc derived above.
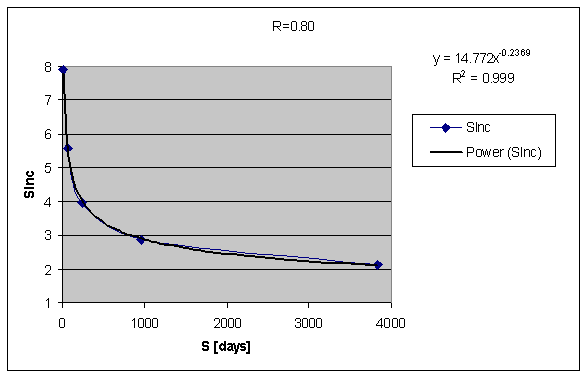
When inspecting the SInc matrix, we immediately see that SInc as a function of S for constant R is excellently described with a negative power function as in the exemplary data set below:
Which is even more clear in the log-log version of the same graph:
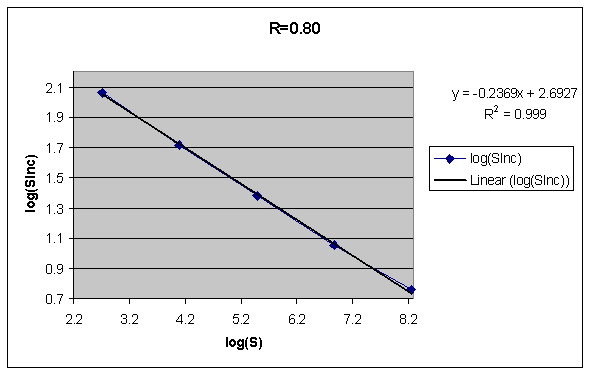
The conclusion on the power dependence between SInc and S above confirms previous findings. In particular, the decline of R-Factors along repetition categories in SuperMemo has always been best approximated with a power function.
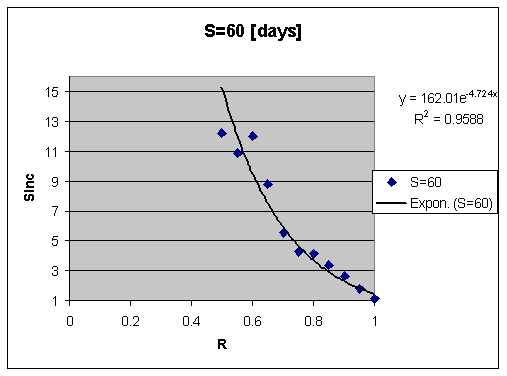
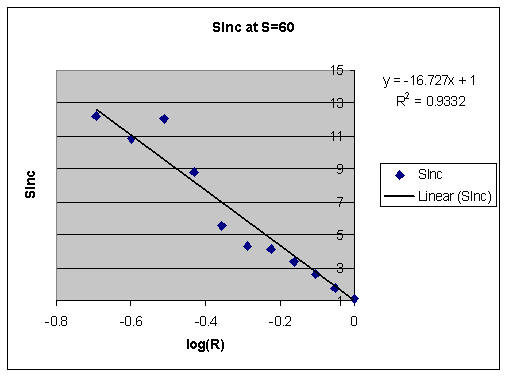
When we look for the function reflecting the relationship of SInc and R for constant S, we see more noise in data due to the fact that SuperMemo provides far fewer hits at low R (its algorithm usually attempts to achieve R>0.9). Nevertheless, upon inspecting multiple data sets we have concluded that, somewhat surprisingly, SInc increases exponentially when R decreases (see later to show how this increase results in a nearly linear relationship between SInc and time). The magnitude of that increase is higher than expected, and should provide further evidence of the power of the spacing effect. That conclusion should have a major impact on learning strategies.
Here is an exemplary data set of SInc as a function of R for constant S. We can see that SInc(R) can be quite well approximated with a negative exponential function:
And the semi-log version of the same graph with a linear approximation trendline intercept set at 1:
Interestingly, stability increase for retrievability of 100% may be less than 1. Some molecular research indicates increased lability of memories at review time. This is one more piece of evidence that repetitive cramming can hurt you not only by costing you extra time.
7. Symbolic formula for memory stability increase
For constant knowledge difficulty, we need to apply two-dimensional surface-fitting to obtain the symbolic formula for SInc. We have used a modified Levenberg-Marquardt algorithm with a number of possible symbolic function candidates that might accurately describe SInc as a function of S and R. The algorithm has been enhanced with a persistent random-restart loop to ensure that the global maxima be found. We have obtained the best results with the following formula:
- (7.1) SInc=aS–b*ecR+d;
where:
- SInc – increase in memory stability as a result of a repetition (quotient of stability S before and after the repetition)
- R – retrievability of memory at the moment of repetition expressed as the probability of recall in percent
- S – stability of memory before the repetition expressed as an interval generating R=0.9
- a, b, c, d – parameters that may differ slightly for different data sets
- e – base of the natural logarithm
The parameters a, b, c, d would vary slightly for different data sets, and this might reflect user-knowledge interaction variability (i.e. different sets of learning material presented to different users may result in a different distribution of difficulty as well as with a different grading criteria that may all affect the ultimate measurement).
For illustration, an average value of a, b, c, d taken from several data sets has been found to be: a=76, b=0.023, c=-0.031, d:=-2, with c varying little from set to set, and with a and d showing relatively higher variance.
The above formula produced SInc values that differed on average by 15% from those obtained from data in the form of the SInc matrix on homogenous data sets (i.e. repetition history sets selected for: a single student, single type of knowledge, low difficulty, and a small range of A-Factors).
As inter-repetition interval increases, despite double exponentiation over time, SInc increases along a nearly-linear sigmoid curve (both negative exponentiation operations canceling each other):
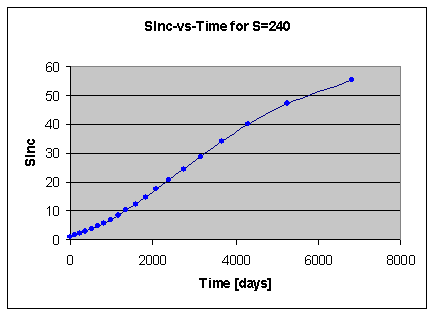
Fig 7.1. The graph of changes of SInc in time. This graph was generated for S=240 using Eqn. 7.1
The nearly linear dependence of SInc on time is reflected in SuperMemo by computing the new optimum interval by multiplying the O-Factor by the actually used inter-repetition interval, not by the previously computed optimum interval (in SuperMemo, O-Factors are entries of a two-dimensional matrix OF[S,D] that represent SInc for R=0.9).
8. Expected value of the increase in memory stability depending on retrievability
Let’s define the expected value of the increase in memory stability as:
- (8.1) E(SInc)=SInc*R
where:
- R – retrievability
- SInc – increase in stability as per Eqn (7.1)
- E(SInc) – expected probabilistic increase in stability (i.e. the increase defined by SInc and diminished by forgetting)
From Eqn (7.1) we have E(SInc)=(aS–b*ecR+d)*R. By finding the derivative dE(SInc)/dR, and equating it with zero, we can find retrievability that maximizes the expected increase in stability for various levels of stability. Figure 8.1. shows the graph of E(SInc) as a function of R for S<15. Using terminology known to users of SuperMemo, the maximum expected increase in memory stability for short intervals occurs for the forgetting index equal to 60%! This also means that the maximum forgetting index allowed in SuperMemo (20%) results in the expected increase in stability that is nearly 80% less than the maximum possible (if we were only ready to sacrifice high retention levels).
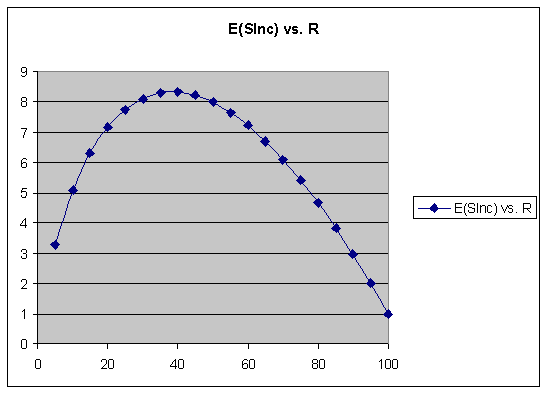
Fig. 8.1. Expected increase in memory stability E(SInc) as a function of retrievability R for stability S<15.
9. Knowledge complexity affects the forgetting rate
We believe that the difficulty in learning is determined by complexity of remembered information. Complex knowledge results in two effects:
- increased interference with other pieces of information
- difficulty in uniform stimulation of memory trace sub-components at review time
Both components of difficulty can be counteracted with the application of appropriate representation of knowledge in the learning process.
Let us see how complexity of knowledge affects build up of memory stability.
Imagine we would like to learn the following: Marie Sklodowska-Curie was a sole winner of the 1911 Nobel Prize for Chemistry. We can take two approaches: one in which knowledge is kept complex, and one with easy formulations. In a complex variant, a double cloze might have been formulated for the purpose of learning the name of Marie Curie and the year in which she received the Nobel Prize.
- Q: […] was a sole winner of the […] Nobel Prize for Chemistry
- A: Marie Sklodowska-Curie, 1911
In a simple variant, this double cloze would be split and the Polish maiden name would be made optional and used to create a third cloze:
- Q: […] was a sole winner of the 1911 Nobel Prize for Chemistry
- A: Marie (Sklodowska-)Curie
- Q: Marie Sklodowska-Curie was a sole winner of the […](year) Nobel Prize for Chemistry
- A: 1911
- Q: Marie […]-Curie was a sole winner of the 1911 Nobel Prize for Chemistry
- A: Sklodowska
In addition, in the simple variant, a thorough approach to learning would require formulating yet two cloze deletions, as Marie Curie was also a winner of 1903 Nobel Prize for Physics (as well as other awards):
- Q: Marie Sklodowska-Curie was a sole winner of the 1911 Nobel Prize for […]
- A: Chemistry
- Q: Marie Sklodowska-Curie was a sole winner of the 1911 […]
- A: Nobel Prize (for Chemistry)
Let us now consider the original composite double cloze. For the sake of the argument, let’s assume that remembering the year 1911 and the name Curie is equally difficult. The retrievability of the composite memory trace (i.e. the entire double cloze) will be a product of the retrievability for its subtraces. This comes from the general rule that memory traces, in most cases, are largely independent. Although forgetting one trace may increase the probability of forgetting the other, in a vast majority of cases, as proved by experience, separate and different questions pertaining to the same subject can carry an entirely independent learning process, in which recall and forgetting are entirely unpredictable. Let us see how treating probabilities of recall as independent events affects the stability of a composite memory trace:
- (9.1) R=Ra*Rb
where:
- R – retrievability of a binary composite memory trace
- Ra and Rb – retrievability of two independent memory trace subcomponents (subtraces): a and b
- (9.2) R=exp(-kt/Sa)*exp(-kt/Sb)=exp(-kt/S)
where:
- t – time
- k – ln(10/9)
- S – stability of the composite memory trace
- Sa and Sb – stabilities of memory subtraces a and b
- (9.3) -kt/S=-kt/Sa-kt/Sb=-kt(1/Sa+1/Sb)
- (9.4) S=Sa*Sb/(Sa+Sb)
We will use the Eqn. (9.4) if further analysis of composite memory traces. We might expect, that if initially, stability of memory subtraces Sa and Sb differs substantially, subsequent repetitions, optimized for maximizing S (i.e. with the criterion R=0.9) might worsen the stability of subcomponents due to sub-optimal timing of review. The next section shows this is not the case.
10. Convergence of sub-stabilities for composite memory traces
We have seen earlier than R=exp(-k*t/S). If we generate a double-cloze, we are not really sure if a single repetition generates a uniform activation of both memory circuits responsible for storing the two distinct pieces of knowledge. Let us assume that the first repetition is the only differentiating factor for the two memory traces, and that the rest of the learning process proceeds along the formulas presented above.
To investigate the behavior of stability of memory subtraces under a rehearsal pattern optimized for composite stability with the criterion R=0.9, let us take the following:
- Sa=1
- Sb=30
- S=Sa*Sb/(Sa+Sb) (from Eqn. 9.4)
- SInc=aS–b*ecR+d (from Eqn. 7.1)
- composite memory trace is consolidated through rehearsal with R=0.9 so that both subtraces are equally well re-consolidated (i.e. the review of the composite trace is to result in no neglect of subtraces)
As can be seen in Fig. 10.1., memory stability for the composite trace will always be less than the stability for individual subtraces; however, the stabilities of subtraces converge.
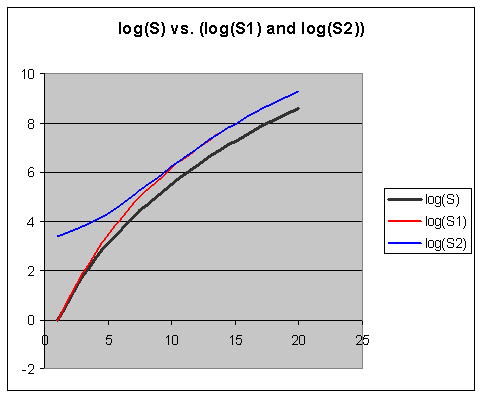
Fig. 10.1. Convergence of stability for memory sub-traces rehearsed with the same review pattern optimized for the entire composite memory trace (i.e. review occurs when the composite retrievability reaches 0.9). The horizontal axis represents the number of reviews, while the vertical axis shows the logarithm of stability. Blue and red lines correspond with the stability of two sub-traces which substantially differed in stability after the original learning. The black line corresponds with the composite stability (S=Sa*Sb/(Sa+Sb)). The disparity between Sa and Sb self-corrects if each review results in a uniform activation of the underlying synaptic structure.
11. Composite stability increase is the same as the increase in stability of sub-traces
Let us now figure out how much SInc differs for composite stability S and for subtrace stabilities Sa and Sb? If we assume the identical stimulation of memory subtraces, and denote SInca and SIncb as i, then for repetition number r, we have:
- SInca=SIncb=i
- Sa[r]=Sa[r-1]*i
- Sb[r]=Sb[r-1]*i
- S[r]=Sa[r]*Sb[r]/(Sa[r]+Sb[r])=
- =Sa[r-1]*Sb[r-1]*i2/(Sa[r-1]*i+Sb[r-1]*i)=
- =i*(Sa[r-1]*Sb[r-1])/(Sa[r-1]+Sb[r-1)=i*S[r-1]
In other words:
- (11.1) SInc=i=SInca=SIncb
The above demonstrates that with the presented model, the increase in memory stability is independent of the complexity of knowledge assuming equal re-consolidation of memory subtraces.
12. Molecular model of memory based on the distinction between memory stability and memory retrievability
At the molecular level, the distinction between stability and retrievability of memory may help resolve seeming paradoxes in attempts to answer questions such as “Do ampakines improve memory?“. If ampakines activate AMPA, they may increase retrievability, yet they might worsen conditions for unblocking NMDA and memory consolidation. Ampakines might paradoxically improve recall and worsen learning. The distinctions of the S/R Model are central for similar analyses. Most memory research deal with short time scales and would only produce R-relevant results. This emphasizes the importance of the S/R Model in disentangling experimental contradictions.
Let us demonstrate the value of the S/R Model for building molecular models of long-term memory. In these models, we use the guidelines formulated in two-component model of long-term memory (Wozniak, Gorzelanczyk, Murakowski, 1995):
- R should be related to the probability of recall; forgetting should be understood as the drop of R to zero
- R should reach a high value as early as after the first repetition, and decline rapidly in the matter of days
- S determines the rate of decline of R (the higher the stability of memories, the slower the decrease of retrievability)
- With each review, as S gets higher, R declines at a slower rate
- S should assume a high value only after a larger number of repetitions
- S should not change (significantly) during the inter-repetition interval
- If the value of R is high, repetitions do not affect S significantly (spacing effect)
- R and S increase only as a result of an effective repetition (i.e. repetition that takes place after a sufficiently long interval)
- Forgetting should result in the drop of S to zero
Exemplary model of long-term memory based on the S/R guidelines:
Variables:
- R is phosphorylation of AMPA
- S is the number of AMPA receptors inserted in the membrane
Guidelines (cf. Wozniak, Gorzelanczyk, 1998):
- Phosphorylated AMPA improves neural transmission, hence better recall
- At learning, calcium flowing through NMDA activates a cascade (incl. CaMKII) that leads to phosphorylation of AMPA; initially, spontaneous dephosphorylation proceeds fast
- The more AMPA gets inserted in the membrane, the more stable the phosphorylated AMPA is (perhaps through structural changes in the PSD); dephosphorylation proceeds more slowly
- Stability changes in the membrane lead to more AMPA being stably incorporated; the stability increases on each effective review
- The longer the synapse survives in the stabilized state, the more it gets stabilized on each review
- When there is no recall, AMPA dephosphorylation gradually reduces R, but AMPA remains in the membrane and the stability does not change much
- When there is a high phosphorylation of AMPA, the synapse transmits easily and NMDA does not get Mg-unblocked due to hyperpolarization; there is no increase in stability; only when dephosphorylation reduces R (AMPA transmission), can NMDA Mg block be relieved and produce an increase in stability through calcium currents
- When NMDA gets unblocked new AMPA gets incorporated in the membrane and it gets fully phosphorylated (maximum retrievability). Synthesis of more AMPA receptors can also play a part
- As S increases, its further increase becomes easier through changes in the PSD structure
Summary
- Representing stability of memory as an inter-repetition interval that results in retrievability of 0.9 makes further theoretical fruitful investigations easier
- Stability of memory can reflect the probability of re-occurrence of events in the environment. However, the spacing effect precludes treating the occurrence of events as a Poisson process
- With each successive review, the increase of stability is less in magnitude. This can be explained if environmental events are treated as a Poisson process. For low occurrence rates, the increase in stability in the first review as predicted by the Poisson process approaches 2
- Forgetting is a form of negative exponential decay. Large datasets collected with SuperMemo confirm this observation. Small size and heterogeneity of samples explains why other researchers might have arrived at other conclusions. In addition, not all forms of learning curves can be used to represent retrievability
- Increase in stability due to rehearsal is lower for higher levels of stability. This relationship is expressed by a negative power function
- Increase in stability due to rehearsal is far more pronounced for lower levels of retrievability. This relationship seems to be best expressed by a negative exponential function
- A symbolic formula for the increase in stability due to rehearsal has been found. This finding was possible with a large datasets collected with SuperMemo. The formula may open rich vistas towards further progress in modeling long-term memory. It also opens the field to researchers without a background in programming
- Increase in stability due to rehearsal depends on the timing of the rehearsal. The relationship between time and the increase in stability is sigmoid in nature, yet in practical applications for limited time ranges can well be approximated with linear functions
- The expected increase in stability understood as the product of retrievability and the increase in stability is maximized at retrievability levels around 0.4
- The stability of binary composite memories can be found from subtrace stabilities using the formula: S=Sa*Sb/(Sa+Sb). Similar formulas can be derived for composite memories built of more memory subtraces
- If the re-consolidation of memory subtraces is equal, stabilities of memory subtraces converge in the review process
- If the re-consolidation of memory subtraces is equal, the increase in memory stability of the composite trace is equal to the increase in memory stability of individual subtraces
- The S/R Model of memory can be helpful in the deconvolution of contradictory findings in research on molecular basis of long-term memory
References:
- Anderson, J. R., & Schooler, L. J. (1991). Reflections of the environment in memory. Psychological Science, 2, 396 – 408
- Anderson, R. B. (1997). The power law as the emergent property. Bowling Green State University.
- Anderson, R. B., & Tweney, R. (1997). Artifactual power curves in forgetting. Memory & Cognition, 25,724-730
- Ebbinghaus H. (1885). Memory: A Contribution to Experimental Psychology
- Ritter, F.E., & Schooler, L. J. (2002). The learning curve. Encyclopedia of the Social and Behavioral Sciences. 8602-8605
- Wozniak, P.A., Gorzela?k, E.J. (1992). Optimal scheduling of repetitions in paired-associate learning. Acta Neurobiologiae Experimentalis, Vol. 52, p. 189
- Wozniak P.A, Gorzela?k, E.J., Murakowski J. (1995). Two components of long-term memory. Acta Neurobiologiae Experimentalis, Vol. 55, p. 301-305
- Wozniak P.A, Gorzela?k, E.J., (1998). Hypothetical molecular correlates of the two-component model of long-term memory. Symposium of the Polish Network of Molecular and Cellular Biology


